Argus is a self-hosted observability platform a complete local environment for metrics, logs, traces, dashboards, and alerting, running on Docker Compose with the LGTM stack.
Instead of consuming a managed monitoring service, I built the telemetry pipeline: instrumented applications, scrape configuration, log shipping, trace ingestion, correlation between all three signals, alert rules, and per-alert runbooks.
Why Argus?
Most portfolio observability projects stop at “I added Prometheus and Grafana.” That proves you can follow a tutorial. It does not prove you can operate a telemetry pipeline.
Argus is different:
- Built, not installed — every layer is configured by hand: scrape targets, Promtail discovery, OTLP receivers, Tempo retention, Alertmanager routing
- Correlated, not siloed — a log line links to its trace, and a trace links back to logs and metrics
- Versioned as code — dashboards, alert rules, datasources, and provisioning are all files in Git, not clicks in a UI
- Verification-first — every layer has an acceptance script and captured evidence before the next layer starts
- Honest about failure — alerts are tested deterministically through a fault-injection endpoint, and the stack was soaked for an hour to prove it stays up
Why I Built Argus
I built Argus to understand observability as an engineer who operates systems, not as a user of dashboards. Reading about the three pillars is easy; making them agree with each other is not. When a request is slow, the useful question is not “what does the latency graph say” but “which trace, which log line, and which metric describe the same request?” That question only has an answer if the pipeline is built deliberately.
I also wanted to practice the discipline around observability: knowing what “healthy” means for each service, bounding how much data you keep, and writing down what to do when an alert fires. Those are operational skills, and they are easier to learn on a system I own end to end.
Architecture
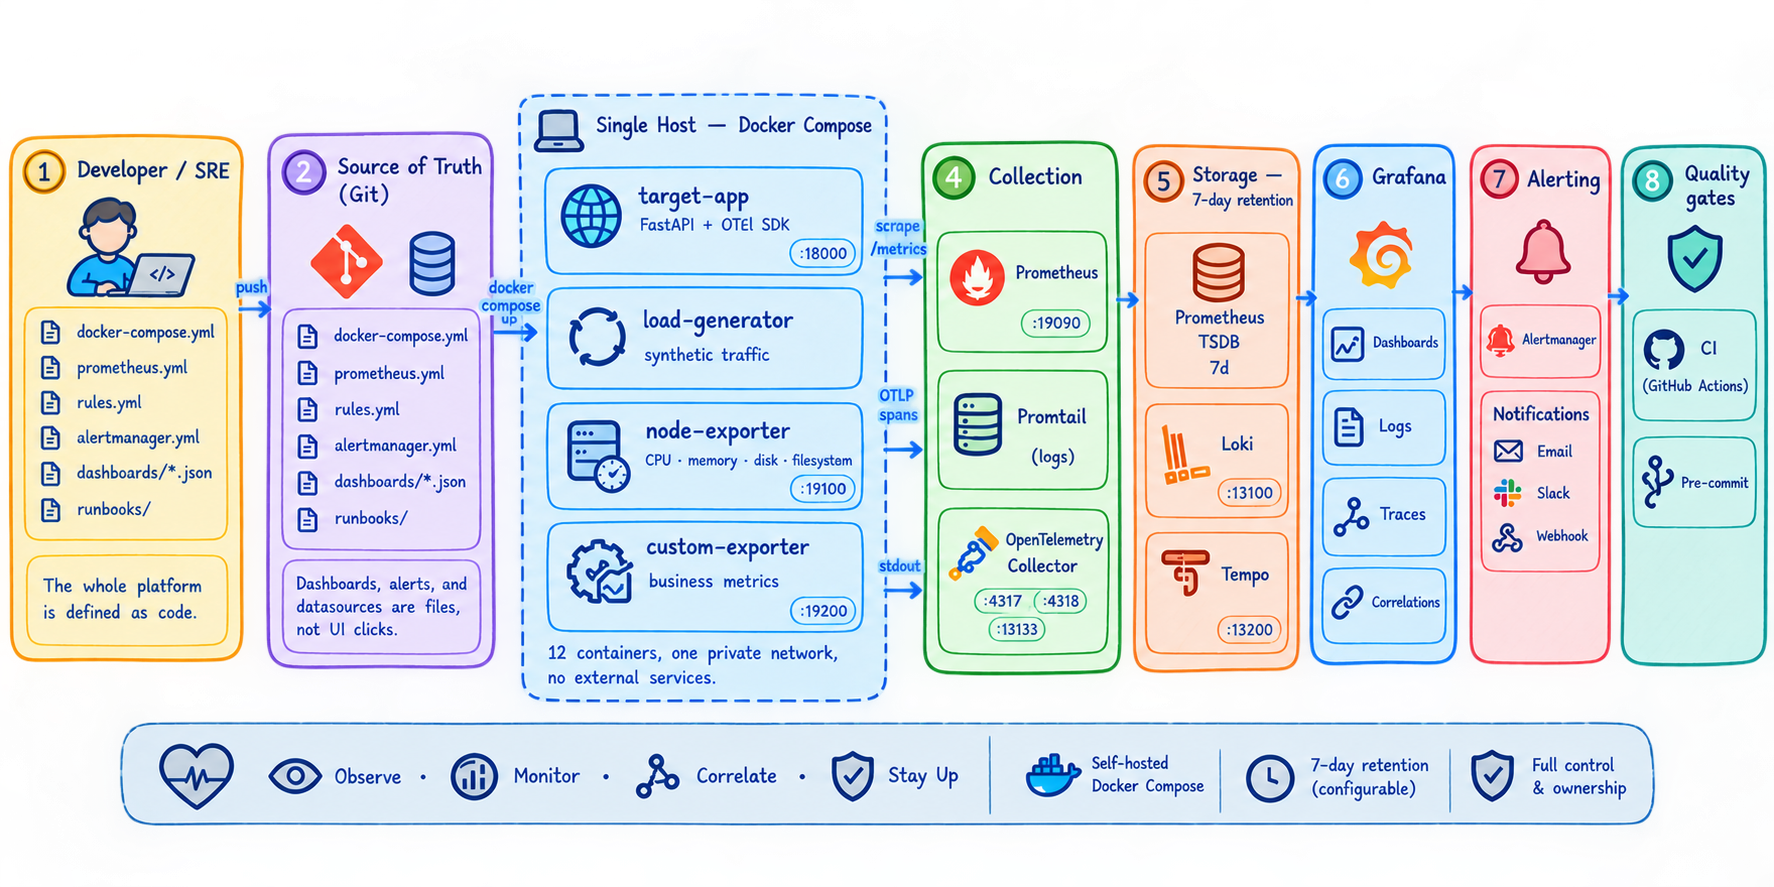
The Six Layers
| Layer | What it does | What I had to get right |
|---|---|---|
| Metrics | Prometheus + node-exporter + two application exporters | Scrape intervals, label design, PromQL for rate and quantile |
| Logs | Promtail + Loki | Label cardinality, Docker discovery, retention |
| Traces | OpenTelemetry Collector + Tempo | OTLP receivers, batching, retention, storage paths |
| Correlation | Grafana datasource config | Derived fields, trace-to-log and trace-to-metric pivots |
| Alerting | Prometheus rules + Alertmanager | Symptom vs cause, severity routing, inhibition, runbooks |
| Hardening | Compose healthchecks and limits | Readiness vs liveness, bounded growth, startup ordering |
What I Learned
Metrics are an interface
Metric names and labels are a contract, not a byproduct: stable names and low-cardinality labels keep queries composable. PromQL also forced me to think in windows, since an error rate is a ratio over a range — a two-minute window catches a spike that a five-minute window ignores.
Logs route with labels, explain with content
My first instinct was to label everything, but high-cardinality labels like request IDs create one index stream per value. Labels should route queries with low-cardinality values, while the detail stays in the log line.
Tracing makes the request the unit
A span is one unit of work with a duration and a parent, so a request becomes a tree that shows where the time actually went. The collector keeps the pipeline portable: the app speaks OTLP and knows nothing about Tempo, so only the exporter changes if the backend does.
Correlation and alerting are where the value is
Correlation turns three tools into one investigation — the app logs its trace_id, Grafana extracts it with a derived field, and a log line opens its trace. Alerts follow the same logic: page on symptoms like error rate and latency rather than causes like CPU, with grouping, inhibition, and a runbook behind each rule.
The stack is itself a system that fails
“Running” is not “ready”: I added readiness healthchecks, replaced bare depends_on with service_healthy, and found that Tempo silently keeps traces for 14 days by default — twice the other stores. Configuration needs tests for the same reason, so promtool, amtool, Loki validation, and Compose schema checks run in pre-commit and CI, which caught a real host-path bug in my own pipeline.
Troubleshooting Notes
A few failures that were not obvious, and what they taught me:
- Mounting rules inside a read-only config directory fails. Docker cannot create a mountpoint under a read-only bind, so rules live at
/etc/prometheus-rulesinstead. - A healthcheck can create the problem it detects. Probing
/metricswith a spider request aborted the response body and made node-exporter logbroken pipeevery 30 seconds. Probing/was enough. - Distroless images cannot be healthchecked by exec. The collector exposes an HTTP health endpoint instead.
- Grafana provisioning does not update existing datasources in place. New ones appear, changed ones need the volume reset.
- Tempo runs as a non-root user but its volume is root-owned. Locally it runs as root; in Kubernetes the correct fix is
fsGroup.
Links
- Repository: github.com/chameauu/argus
- Prometheus Documentation: prometheus.io/docs
- Grafana Loki Documentation: grafana.com/docs/loki
- Grafana Tempo Documentation: grafana.com/docs/tempo
- OpenTelemetry Documentation: opentelemetry.io/docs
Built to understand observability from the inside: instrument it, ship it, correlate it, alert on it, and prove it stays up.